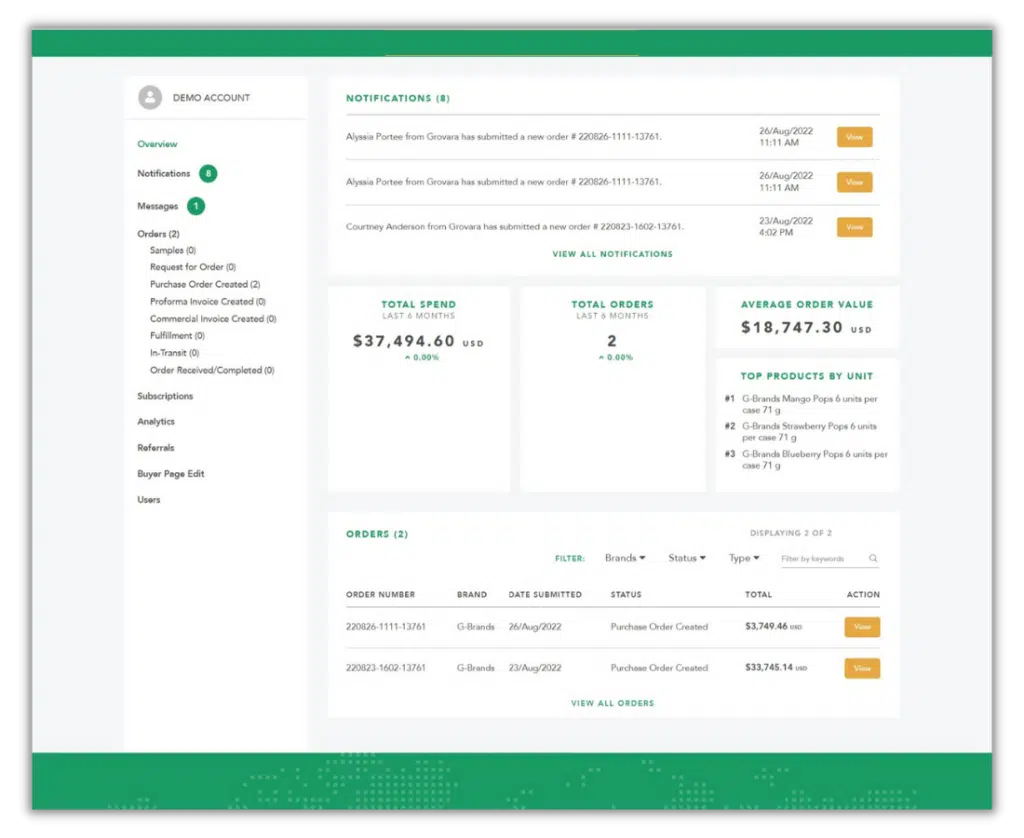
The Grovara Platform offers users the opportunity to quickly view robust and customizable metrics for visibility into account performance.
To generate sales reports from the Grovara Platform, follow the steps below.
1. Login #
Login to the Grovara Platform
2. Analytics #
This will open the account Dashboard; Scroll down and click “Analytics” on the left-hand toolbar
3. View Products #
On the Analytics Dashboard reports on a variety of data are visible. The data below is most frequently viewed by users.
-
-
- Order Value Booked
This graph represents the order value of sales booked. All orders except for sample orders, canceled orders, returns, or orders that have been deleted - Sales Shipped
All orders that have been shipped, except for sample orders, canceled orders, returns, or orders that have been deleted - Top Cases Ordered
The SKU that had the most cases purchased in each time period - Samples Ordered
The summation of all samples requested in a given time period - Expired/Expiring Brand Documents
Brand Documents are expired if the expiration date is older than the date at which the data is being viewed; Brand Documents are considered “expiring soon” if they expire within 3 months from the date at which the data is being viewed
This report is only applicable to Brand Users
- Order Value Booked
-
The data can be filtered based on the parameters below, both collectively and individually.
-
-
- Retailers
The reports can be viewed per particular retailer - Country
The reports can be viewed per the country of origin of the Buyer - Start Date and End Date
The time period of the reports can be selected
- Retailers
-
NOTE: each graph includes total data (in green) and Average data (in blue).
To download the data from the report, click the “Download Raw Data” button and the content will download as an Excel file (.csv format).
RELATED CONTENT
Optimizing Brand and Product Searchability
How to Place an Order
Subscription Orders
